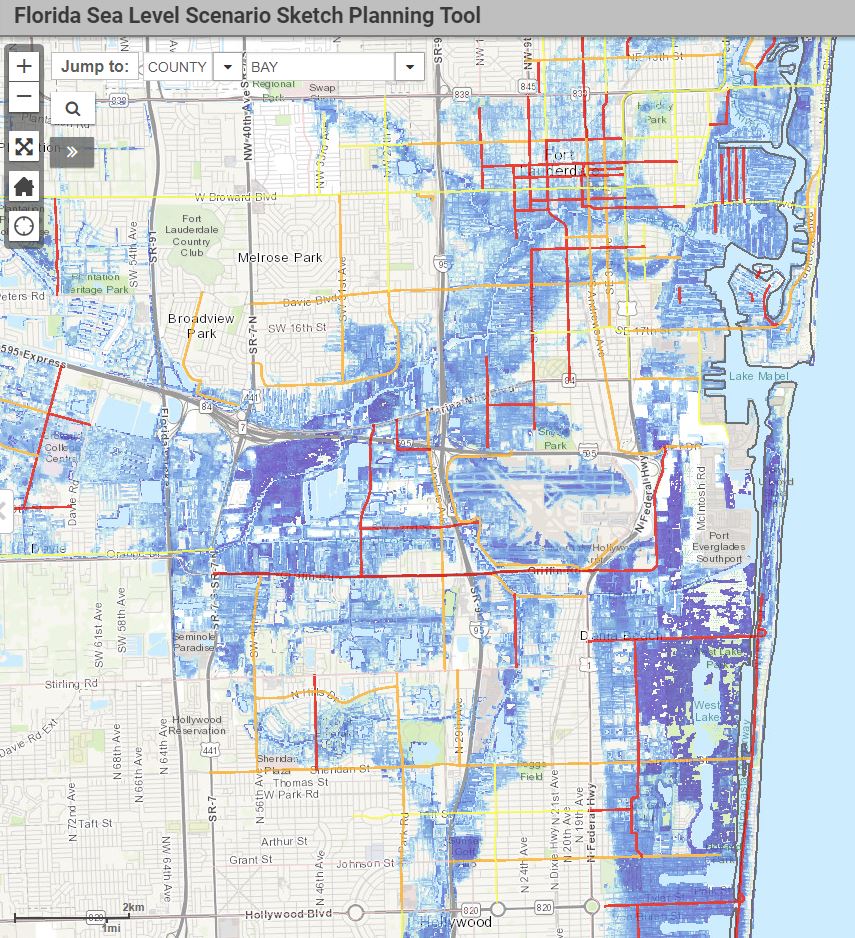

The GeoPlan Center has developed an interactive Sea Level Scenario (SLS) Sketch Planning Tool, using Geographic Information Systems (GIS) data visualization, to facilitate the identification of transportation infrastructure potentially at risk from projected sea level changes. The tool is designed to support the identification of affected infrastructure, and provide evidence-based visualization to inform transportation planning processes.
The SLS Sketch Planning Tool was created with funding from the Florida Department of Transportation. This work has been completed over multiple phases and over a decade (2012 – 2025). The tool was most recently updated in 2025, adding new transportation data layers, SLR projections, and SLR inundation models from NOAA.
The Map Viewer makes geospatial identification processes available to all levels of GIS training and helps provide decision support for adaptive management and mitigation strategy development in numerous organizations. The GeoPlan Center has conducted training sessions on using the SLS Sketch Planning Tool Map Viewer to support planning projects and decision-making. The Map Viewer hosts a diverse mix of users, including academics, private professionals, government officials, and advocacy organizations.
The SLS Sketch Planning Tool is evolving and improving. As sea level projections and tidal datums are modified over time, horizon year, and place, the ability to have a framework of tools that are customizable (based on the latest data inputs and projections) will facilitate the revision and reassessment of potentially impacted areas and related infrastructure. In addition, as higher resolution data inputs become available, the analysis can change from statewide and regional to more local in scale. The ongoing development of this project is supporting higher resolution data inputs and facilitate reproduction of the data outputs (inundation surfaces and affected transportation infrastructure layers).