Skip to content
About
People
Students
Blog
Contact
Projects
Current Projects
Data Highlights
Past Projects
GeoPlan in the News
Software
ArcGIS Online
ArcGIS Pro
Software FAQs
Other Software
Training
Online GIS Certificate
FAQs
Orientation
Services
Search
Search for:
Search
University of Florida GeoPlan Center
Geo-Facilities Planning and Information Research Center
About
People
Students
Blog
Contact
Projects
Current Projects
Data Highlights
Past Projects
GeoPlan in the News
Software
ArcGIS Online
ArcGIS Pro
Software FAQs
Other Software
Training
Online GIS Certificate
FAQs
Orientation
Services
Search
Search for:
Search
Home
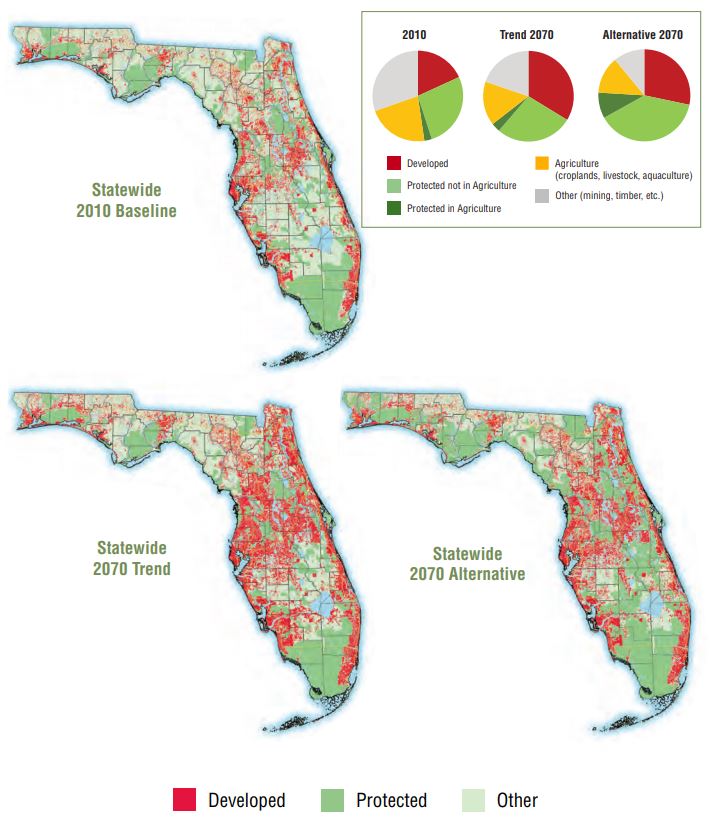
Florida 2070 Example
Florida 2070 Example
Florida 2070 Example
Full size
710 × 823
pixels
Previous image
Next image